
Building Your Winning Portfolio: Unveiling Companies' Profitability with some Key Ratios
- Max Teh

- Aug 22, 2024
- 3 min read
Updated: Mar 23
Table of Contents
Disclaimer: This communication is provided for information purposes only and is not intended as a recommendation or a solicitation to buy, sell or hold any investment product. Readers are solely responsible for their own investment decisions.
KEYPOINTS
🔑 Profitability ratios are useful to gauge a company's financial strength.
🔑 Profitability ratios like gross margin, operating margin, and return on equity reveal how efficiently a company turns sales into profit and uses shareholder money.
🔑 Look for companies with consistent or growing profitability ratios for a stronger chance of long-term success.
Building a winning portfolio is about finding companies poised for growth. Today, we delve into profitability, a crucial aspect of a healthy investment.
Profitability Ratios to monitor:
Note: These ratios are only applicable for companies already generating profits. For non-profitable companies, focus on cash flow analysis.
Imagine a company as a money-making machine. Profitability ratios help us see how efficient this machine is. Here are the key ones:
Gross Margin: This shows what percentage of each dollar earned remains after accounting for the cost of producing the goods. Basically, how much money is left after paying for materials and direct labor. A high gross margin (think 70% or more) indicates efficient production and room for additional expenses.
Operating Margin: This takes things a step further. It shows what percentage of each dollar earned remains after covering all operating expenses, including marketing, salaries, and rent. Here, 20% or more is generally considered good.
Profit Margin: This is the ultimate test. It reveals what percentage of each dollar earned remains as profit after ALL expenses are deducted, including taxes and interest. This is the company's true bottom line. Similarly, 15% or more is generally considered good.
ROIC (Return on Invested Capital): This measures how effectively a company uses its invested capital (money from debt and equity) to generate profits. A high ROIC (think 15% or more) indicates efficient capital allocation.
ROE (Return on Equity): This shows how well a company uses its shareholders' money to generate profits. Again, a high ROE (around 15% or more) suggests good use of shareholder funds.
Free Cash Flow Margin: This ratio is particularly important to assess non asset-light businesses which require moderate to significant capital expenditure (capex).

Where to find data for these ratios:
You can find these ratios on financial websites like Stockanalysis.com.
for Gross, Operating, Profit & Free Cash Flow Margins
Go to Stockanalysis.com > Search for Company > Financials > Income:

Using Fortinet as an example:

Fortinet's Gross Margin is consecutively close to 80% in the past 5 years.
One thing to note about this is be wary of companies which Gross Margins trend is on decline, as this could signal rising production costs or decreasing selling prices, as is the case with Intel


Both Fortinet's Operating & Profit Margins are above 20% consecutively in the past 5 years, and are both trending upwards which is also a very good sign.
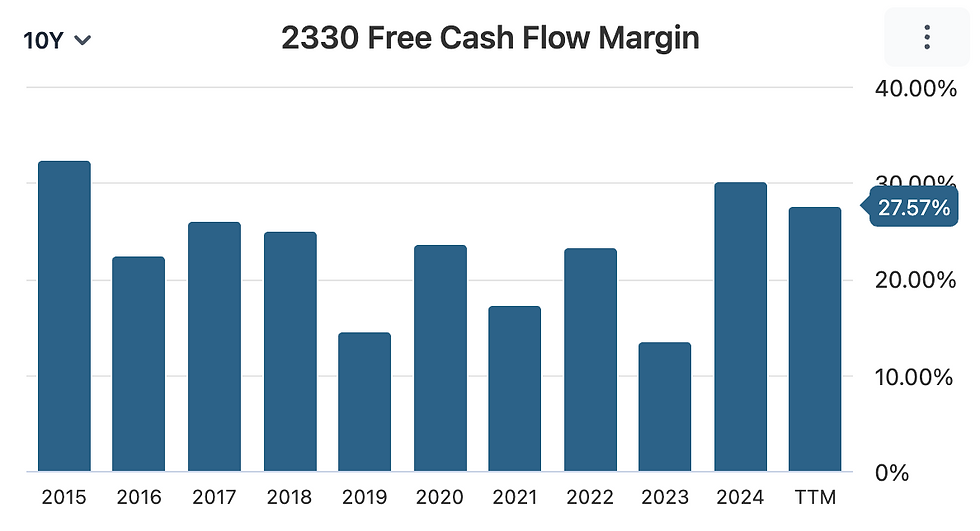
Despite the cyclicality of Taiwan Semiconductor Manufacturing Company's (TSMC)'s Free Cash Flow Margin, its historical figures of frequently exceeding 15% indicates:
strong profitability (signs of of high quality and mature companies with pricing power),
efficient capital usage and cash generation capability from their end.

ii) Macrotrends.com
Alternatively on Macrotrends.com > look under "Margins"
you can find the margins trend line for all the 3 margins above for a more than past 5 years.

for ROE & ROIC
Go to Stockanalysis.com > Search for Company > Financials > Ratios


Fortinet's ROE figures have been above 15% in the past 5 years,
with exception to 2023's figures since they had negative Equity then due to high amount of stock repurchases.

Their ROIC figures too have been consecutively above 15% and is on an upward trend which is a good sign.
Beyond the Numbers - The Trend is Your Friend:
Remember, profitability should be trending upwards.
Companies like Fortinet, Microsoft and Airbnb showcase this beautifully.
By using these ratios and tracking trends, you can identify companies that are not just profitable today, but also positioned for sustained success tomorrow.
So, the next time you evaluate a company, don't forget to wield your profitability ratio compass. It will guide you towards building a winning portfolio.
✅ Add this to your Checklists with IceT.club


sunwin mình cũng chỉ ghé thử vì thấy mọi người nhắc hoài, kiểu tò mò xem trang trông ra sao thôi. Vào cái là thấy giao diện khá dễ chịu, không bị nhồi chữ hay rối mắt. Mình không có ngồi đọc kỹ từng thứ, chủ yếu lướt nhanh để xem họ bố trí có hợp lý không. Điểm mình thích là các mục được gom nhóm nhìn phát hiểu ngay, nên bấm qua lại cũng tiện, khỏi phải mò. Thông tin trên trang họ trình bày theo dạng khối rõ ràng, nhìn gọn và đỡ phải kéo xuống dài lê thê. Nói chung cảm giác như họ ưu tiên cho người mới vào khỏi bị “ngợp”, và cái menu…
Really enjoyed this one — it felt like someone explaining things the way they’d actually tell a friend, not trying to sound fancy. I didn’t have to stop every paragraph to figure out what was going on, and the pacing was chill. Halfway through I clicked around https://newimage.io/ out of curiosity, and it gave me the same “okay, I get it” vibe without dumping a wall of text on you. What helped most here was how the ideas were split up into bite-sized chunks, so skimming still worked when I got distracted. Also appreciated that the page doesn’t feel cluttered; you can scroll without losing your place. The headings are clear and the sections are spaced out in a way…
KUWIN dạo này thấy bạn bè nhắc hoài nên mình cũng ghé thử cho biết. Mình không chơi gì cả, chỉ kiểu vào xem giao diện với cách họ chia mục có dễ tìm không thôi. Vừa vào là thấy trang khá gọn, nhìn phát biết ngay chỗ tin tức với chỗ hướng dẫn giải đáp nằm đâu, không phải bấm qua lại nhiều. Mình có lướt phần hỏi đáp một chút, thấy họ có nói kết quả vận hành bằng RNG chuẩn quốc tế nên đọc cũng đỡ lăn tăn hơn. Mấy mục trên menu đặt khá rõ, chuyển trang không bị rối mắt, và hai khối “TIN TỨC” với “Hướng Dẫn & Giải Đáp” tách riêng ngay trên…
https://tylekeopro.com/ dạo này mình thấy nhiều người nhắc nên cũng bấm vào nghía thử cho biết, kiểu xem nhanh giao diện là chính chứ không có ngồi đọc kỹ. Vừa vào cái thấy trang nhìn khá sáng sủa, khoảng trắng vừa đủ nên lướt không bị ngợp. Mình để ý họ chia nội dung thành từng khối rõ ràng, kéo xuống là biết ngay đoạn nào đang nói về gì, không phải đoán. Cái mình thích nữa là thanh menu đặt dễ nhìn, bấm qua lại mấy mục cũng nhanh, không bị rối như vài trang khác. Nói chung cảm giác dùng nhẹ nhàng, hợp kiểu ai chỉ muốn xem qua rồi tính sau. Nhìn tổng thể thì bố cục…